Media - Shortcodes: Chart
Wednesday, June 25, 2014 12:19 AMShortcodes
[intense_chart]
[intense_chart_data]
Description
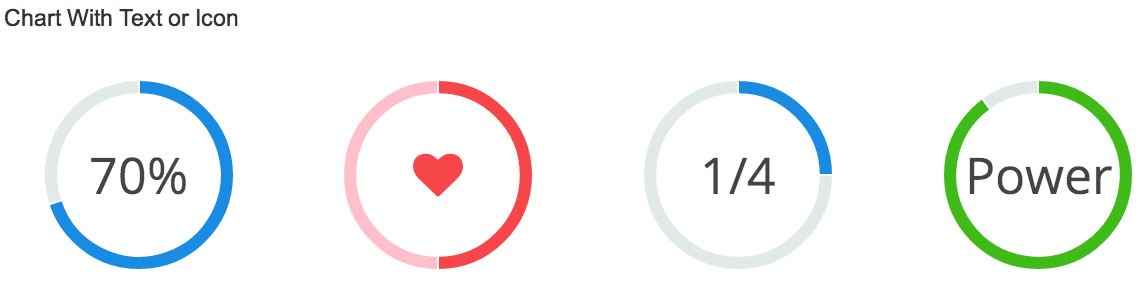
Adds a bar, line, radial, polar area, pie, or doughnut chart. Charts can be animated. You can also add a text or icon over the top of the chart. This is most useful for the doughnut chart.
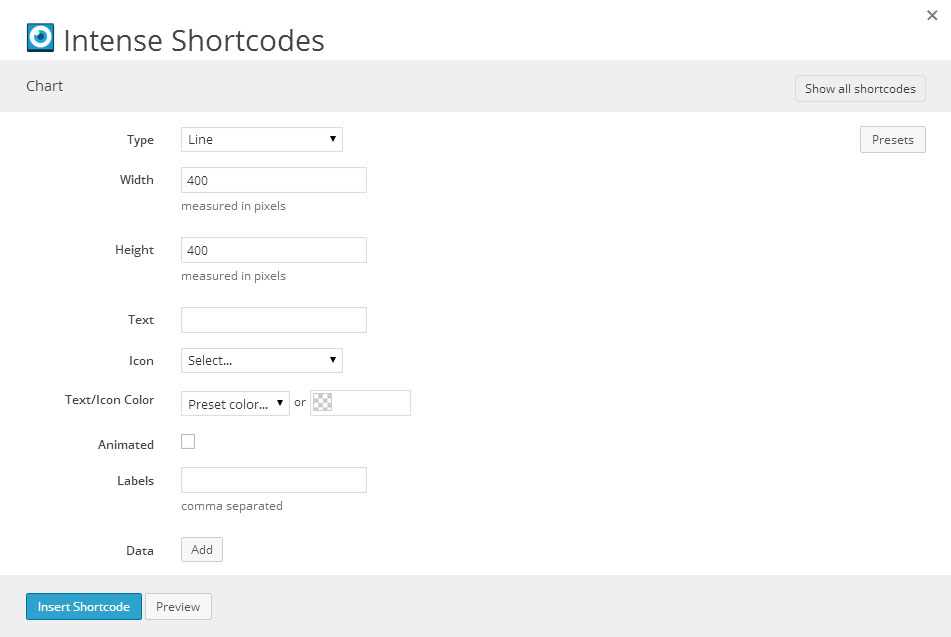
Screenshots
Dialog
Attributes
intense_chart
| Attribute | Type | Dialog Title | Description | Default | Available Values |
|---|---|---|---|---|---|
| type | dropdown | Type | line | line - Line bar - Bar radar - Radar polararea - Polar Area pie - Pie doughnut - Doughnut | |
| width | text | Width | measured in pixels | 400 | |
| height | text | Height | measured in pixels | 400 | |
| text | text | Text | |||
| icon | icon | Icon | see icon list in icon shortcode documentation | ||
| color | color_advanced | Text/Icon Color | option colors - primary, error, info, inverse, muted, success, warning, link web color - hex, rgb, rgba, hsl, hsla, color name (see wikipedia web colors) | ||
| animation | checkbox | Animated | 1 | 1 = true, 0 = false | |
| animation_steps | text | Animation Steps | 60 | ||
| animation_easing | dropdown | Animation Easing | easeOutQuart | linear - linear easeInQuad - easeInQuad easeOutQuad - easeOutQuad easeInOutQuad - easeInOutQuad easeInCubic - easeInCubic easeOutCubic - easeOutCubic easeInOutCubic - easeInOutCubic easeInQuart - easeInQuart easeOutQuart - easeOutQuart easeInOutQuart - easeInOutQuart easeInQuint - easeInQuint easeOutQuint - easeOutQuint easeInOutQuint - easeInOutQuint easeInSine - easeInSine easeOutSine - easeOutSine easeInOutSine - easeInOutSine easeInExpo - easeInExpo easeOutExpo - easeOutExpo easeInOutExpo - easeInOutExpo easeInCirc - easeInCirc easeOutCirc - easeOutCirc easeInOutCirc - easeInOutCirc easeInElastic - easeInElastic easeOutElastic - easeOutElastic easeInOutElastic - easeInOutElastic easeInBack - easeInBack easeOutBack - easeOutBack easeInOutBack - easeInOutBack easeInBounce - easeInBounce easeOutBounce - easeOutBounce easeInOutBounce - easeInOutBounce | |
| labels | text | Labels | comma separated | ||
| percentage_inner_cutout | text | Inner Cutout | 50 |
intense_chart_data
| Attribute | Type | Dialog Title | Description | Default | Available Values |
|---|---|---|---|---|---|
| fill_color | color_advanced | Fill Color | rgba(220,220,220,0.5) | option colors - primary, error, info, inverse, muted, success, warning, link web color - hex, rgb, rgba, hsl, hsla, color name (see wikipedia web colors) | |
| stroke_color | color_advanced | Stroke Color | rgba(220,220,220,1) | option colors - primary, error, info, inverse, muted, success, warning, link web color - hex, rgb, rgba, hsl, hsla, color name (see wikipedia web colors) | |
| point_color | color_advanced | Point Color | rgba(220,220,220,1) | option colors - primary, error, info, inverse, muted, success, warning, link web color - hex, rgb, rgba, hsl, hsla, color name (see wikipedia web colors) | |
| point_stroke_color | color_advanced | Point Stroke Color | #ffffff | option colors - primary, error, info, inverse, muted, success, warning, link web color - hex, rgb, rgba, hsl, hsla, color name (see wikipedia web colors) | |
| values | text | Values | |||
| colors | text | Colors |
Compatibility
For animations, the chart requires a browser that supports the canvas tag. In Internet Explorer 8 and earlier, the chart will render as an image and animations will not function.
Examples
[intense_content_section]
[intense_row]
[intense_column size="6"]
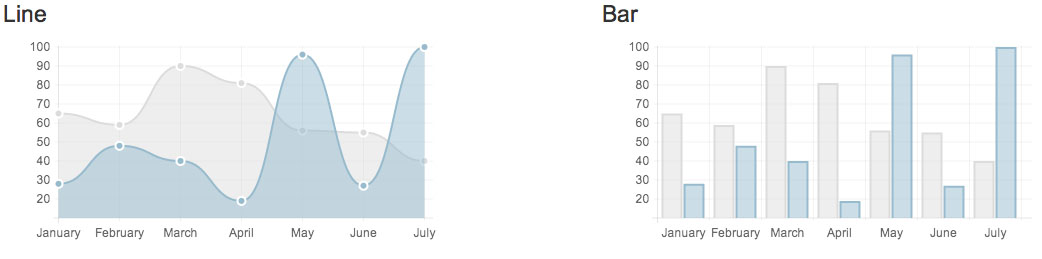
<h2>Line</h2>
[intense_chart width="450" height="200" labels="January,February,March,April,May,June,July" type="line"]
[intense_chart_data fill_color="rgba(220,220,220,0.5)" stroke_color="rgba(220,220,220,1)" point_color="rgba(220,220,220,1)" point_stroke_color="#fff" values="65,59,90,81,56,55,40" /]
[intense_chart_data fill_color="rgba(151,187,205,0.5)" stroke_color="rgba(151,187,205,1)" point_color="rgba(151,187,205,1)" point_stroke_color="#fff" values="28,48,40,19,96,27,100" /]
[/intense_chart]
[/intense_column]
[intense_column size="6"]
<h2>Bar</h2>
[intense_chart width="450" height="200" labels="January,February,March,April,May,June,July" type="bar"]
[intense_chart_data fill_color="rgba(220,220,220,0.5)" stroke_color="rgba(220,220,220,1)" point_color="rgba(220,220,220,1)" point_stroke_color="#fff" values="65,59,90,81,56,55,40" /]
[intense_chart_data fill_color="rgba(151,187,205,0.5)" stroke_color="rgba(151,187,205,1)" point_color="rgba(151,187,205,1)" point_stroke_color="#fff" values="28,48,40,19,96,27,100" /]
[/intense_chart]
[/intense_column]
[/intense_row]
[/intense_content_section]
[intense_hr size="large" /]
[intense_content_section]
[intense_row]
[intense_column size="6"]
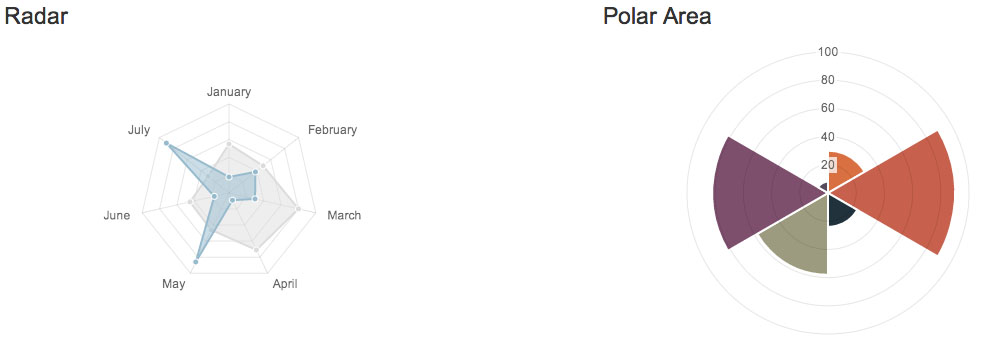
<h2>Radar</h2>
[intense_chart width="450" height="300" labels="January,February,March,April,May,June,July" type="radar"]
[intense_chart_data fill_color="rgba(220,220,220,0.5)" stroke_color="rgba(220,220,220,1)" point_color="rgba(220,220,220,1)" point_stroke_color="#fff" values="65,59,90,81,56,55,40" /]
[intense_chart_data fill_color="rgba(151,187,205,0.5)" stroke_color="rgba(151,187,205,1)" point_color="rgba(151,187,205,1)" point_stroke_color="#fff" values="28,48,40,19,96,27,100" /]
[/intense_chart]
[/intense_column]
[intense_column size="6"]
<h2>Polar Area</h2>
[intense_chart width="450" height="300" type="polararea"]
[intense_chart_data values="30,90,24,58,82,8" colors="#D97041,#C7604C,#21323D,#9D9B7F,#7D4F6D,#584A5E" /]
[/intense_chart]
[/intense_column]
[/intense_row]
[/intense_content_section]
[intense_hr size="large" /]
[intense_content_section]
[intense_row]
[intense_column size="6"]
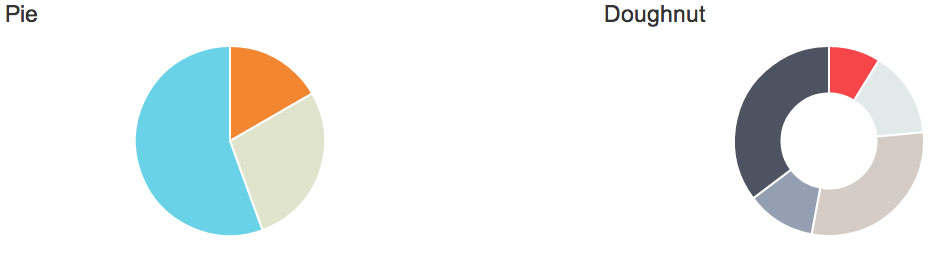
<h2>Pie</h2>
[intense_chart width="450" height="200" type="pie"]
[intense_chart_data values="30,50,100" colors="#F38630,#E0E4CC,#69D2E7,#949FB1,#4D5360,#584A5E" /]
[/intense_chart]
[/intense_column]
[intense_column size="6"]
<h2>Doughnut</h2>
[intense_chart width="450" height="200" type="doughnut" animation_easing="easeOutBounce"]
[intense_chart_data values="30,50,100,40,120" colors="#F7464A,#E2EAE9,#D4CCC5,#949FB1,#4D5360,#584A5E" /]
[/intense_chart]
[/intense_column]
[/intense_row]
[/intense_content_section]
[intense_hr size="large" /]
[intense_content_section]
<h2>Chart With Text or Icon</h2>
[intense_row]
[intense_column size="3"]
[intense_chart width="270" height="200" type="doughnut" animation_easing="easeInSine" animation_steps="100" percentage_inner_cutout="85" text="70%"]
[intense_chart_data values="70,30" colors="#1a8be2,#E2EAE9" /]
[/intense_chart]
[/intense_column]
[intense_column size="3"]
[intense_chart width="270" height="200" type="doughnut" animation_easing="easeInSine" animation_steps="100" percentage_inner_cutout="85" icon="heart" color="#F7464A"]
[intense_chart_data values="50,50" colors="#F7464A,pink" /]
[/intense_chart]
[/intense_column]
[intense_column size="3"]
[intense_chart width="270" height="200" type="doughnut" animation_easing="easeInSine" animation_steps="100" percentage_inner_cutout="85" text="1/4"]
[intense_chart_data values="25,75" colors="#1a8be2,#E2EAE9" /]
[/intense_chart]
[/intense_column]
[intense_column size="3"]
[intense_chart width="270" height="200" type="doughnut" animation_easing="easeInSine" animation_steps="100" percentage_inner_cutout="85" text="Power"]
[intense_chart_data values="90,10" colors="#40ba18,#E2EAE9" /]
[/intense_chart]
[/intense_column]
[/intense_row]
[/intense_content_section]